Upward Channel Pattern
Description
An upward channel, also known as an ascending channel or rising channel, is a bullish chart pattern formed by drawing parallel lines above and below a price trend that's moving upward. The upper line connects the highs, while the lower line connects the lows, both moving in an upward direction.
How to Identify
- Look for a series of higher highs and higher lows forming an upward sloping trend.
- Draw a trendline connecting at least two lows (support line).
- Draw a parallel line above, touching the highs (resistance line).
- The price should bounce between these two lines multiple times.
Trading Strategies
Range Trading
Trade within the channel by buying near the lower support line and selling near the upper resistance line.
- Buy Entry: When price approaches and bounces off the lower support line
- Sell Entry: When price nears the upper resistance line
- Stop Loss: Just below the lower support line for long trades, just above the upper resistance line for short trades
- Take Profit: The opposite boundary of the channel
Breakout Trading
Enter a position when price breaks out of the channel, as this often signals a potential trend change or acceleration.
- Long Entry: When price breaks above the upper resistance line (continuation of uptrend)
- Short Entry: When price breaks below the lower support line (potential trend reversal)
- Stop Loss: Just inside the broken boundary of the channel
- Take Profit: Project the height of the channel from the breakout point
Risk Management
Be aware that channels can persist for extended periods, but they don't last forever. Always use stop-loss orders to protect your positions. The strength of the channel can be gauged by the number of times price has respected the boundaries. Be cautious of false breakouts, especially near the upper boundary of an upward channel.
Example
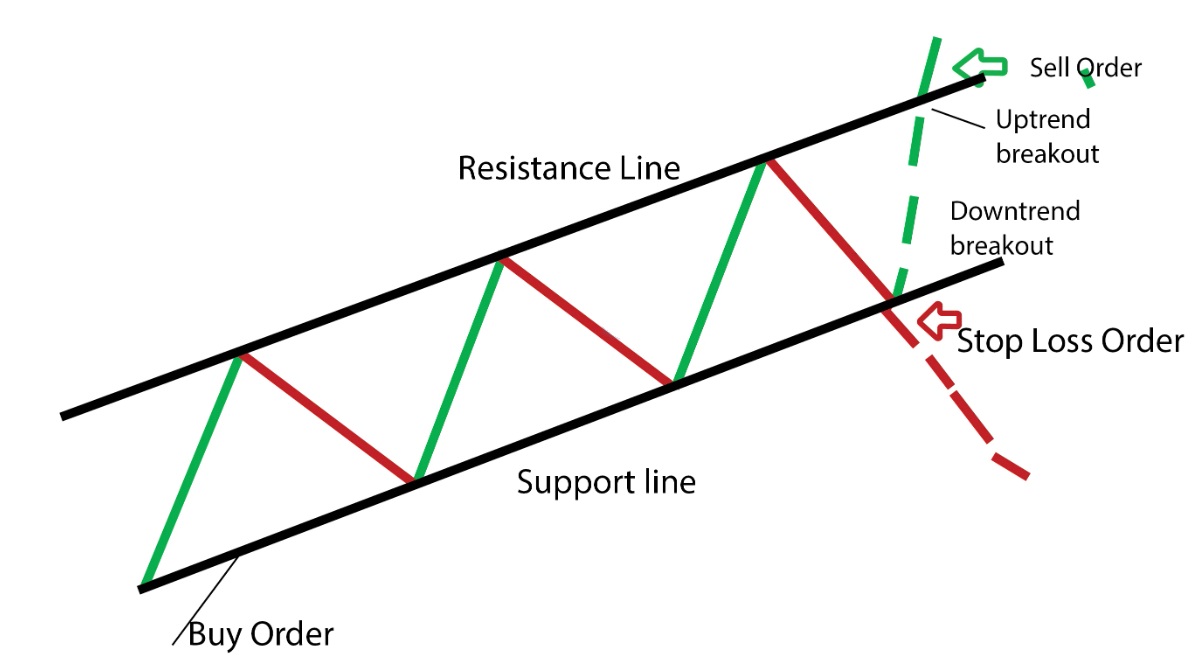
In this example, we can see the price consistently moving upward between two parallel lines, forming an upward channel. The price bounces between the support and resistance lines multiple times before eventually breaking out to the upside, signaling a potential acceleration of the uptrend.