Triangle Pattern
Description
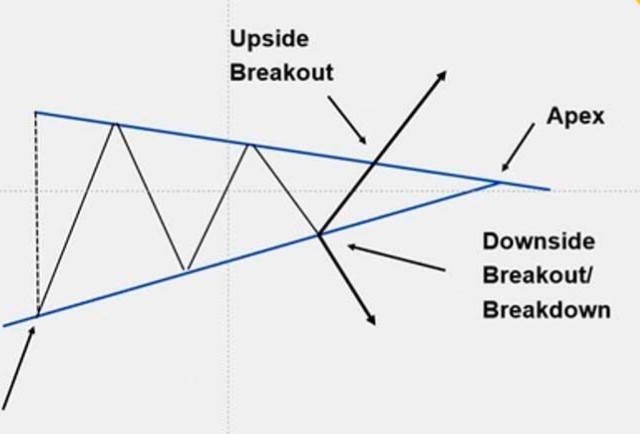
A triangle, also known as a coil or symmetrical triangle, is a chart pattern characterized by two converging trendlines connecting a series of sequential peaks and troughs. This pattern represents a period of consolidation before price breaks out in either direction. Unlike ascending or descending triangles, the symmetrical triangle doesn't have an inherent bullish or bearish bias.
How to Identify
- Look for a series of lower highs forming a descending upper trendline.
- Simultaneously, identify a series of higher lows forming an ascending lower trendline.
- The two trendlines should converge towards a point, forming a triangle shape.
- The pattern should contain at least two swing highs and two swing lows.
- Volume typically decreases as the pattern progresses and often increases on the breakout.
Trading Strategies
Breakout Trading
The most common strategy is to enter a position in the direction of the breakout.
- Long Entry: When price closes above the upper trendline
- Short Entry: When price closes below the lower trendline
- Stop Loss: Just inside the opposite side of the triangle from the breakout
- Take Profit: Project the height of the triangle from the breakout point
Anticipation Trading
More aggressive traders might enter positions near the trendlines, anticipating a bounce.
- Long Entry: When price approaches the lower trendline
- Short Entry: When price approaches the upper trendline
- Stop Loss: Just outside the trendline that was tested
- Take Profit: At or near the opposite trendline
Risk Management
Symmetrical triangles can break out in either direction, so it's crucial to wait for confirmation before entering a trade. Be aware of false breakouts, which are common with this pattern. Consider using a time stop to exit the trade if a breakout doesn't occur within a reasonable timeframe. The closer the price gets to the apex of the triangle, the less reliable the pattern becomes.
Example
In this example, we can see the price forming a series of lower highs and higher lows, creating converging trendlines. The price eventually breaks out to the upside, signaling a potential continuation of the prior uptrend.