Rectangle Pattern
Description
A rectangle pattern, also known as a trading range or consolidation pattern, occurs when the price moves between two parallel horizontal lines. This pattern represents a pause in the trend where supply and demand are in relative equilibrium.
How to Identify
- Look for at least two touch points on both the upper (resistance) and lower (support) lines.
- The price should bounce between these levels multiple times.
- The support and resistance lines should be roughly parallel.
- The pattern can occur in both uptrends and downtrends.
Trading Strategies
Range Trading
Trade within the range by buying near support and selling near resistance.
- Buy Entry: When price bounces off support
- Sell Entry: When price reverses from resistance
- Stop Loss: Just outside the opposite boundary of the rectangle
- Take Profit: The opposite boundary of the rectangle
Breakout Trading
Enter a position in the direction of the breakout when price moves decisively outside the rectangle.
- Entry: When price closes beyond the support or resistance level
- Stop Loss: Just inside the broken boundary of the rectangle
- Take Profit: The height of the rectangle projected from the breakout point
Risk Management
Be cautious of false breakouts, which are common with this pattern. Consider waiting for a retest of the broken level before entering a trade. The longer the rectangle has formed, the more significant the eventual breakout is likely to be.
Example
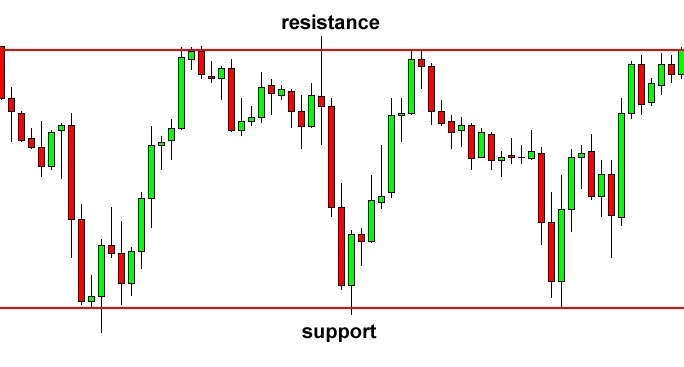
In this example, we can see the price oscillating between clear support and resistance levels, forming a rectangle pattern. The eventual breakout to the upside signals a continuation of the prior uptrend.