Horizontal Support Pattern
Description
A horizontal support is a price level where a downtrend can be expected to pause due to a concentration of demand. As the price of an asset decreases, demand for the shares increases, forming the support line. Market psychology plays a major role as traders and investors remember the past and react to changing expectations.
How to Identify
- Look for a clear downward trend in the price action.
- Identify at least two points where the price has bounced off a similar level.
- The more times the price touches and bounces off this level, the stronger the support.
- The support line should be relatively horizontal (flat).
Trading Strategies
Bounces
Enter a long position when the price approaches the support level and shows signs of bouncing.
- Entry: When price touches the support and starts to move upward
- Stop Loss: Just below the support level
- Take Profit: Previous swing high or resistance level
Breakouts
Enter a short position if the price breaks below the support level, as this often indicates a continuation of the downtrend.
- Entry: When price closes below the support level
- Stop Loss: Just above the broken support level
- Take Profit: Next support level or a predetermined risk-reward ratio
Risk Management
Always use stop-loss orders to protect against unexpected market moves. The strength of the support level can be gauged by the number of times it has been tested. However, remember that support levels can be broken, especially in strong trending markets or after significant news events.
Example
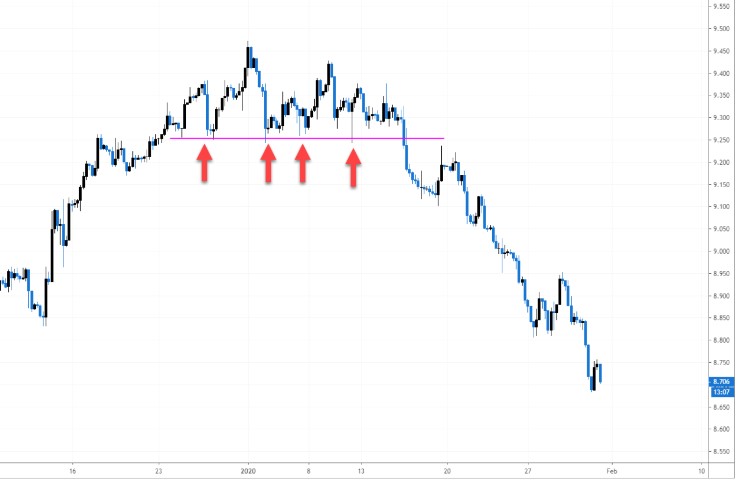
In this example, we can see a clear horizontal support level that has been tested multiple times. Each time the price approaches this level, it bounces back up, demonstrating the strength of the support.