Descending Triangle Pattern
Description
A descending triangle is a bearish chart pattern characterized by a flat lower trendline (support) and a descending upper trendline (resistance). This pattern indicates that sellers are more aggressive than buyers, as they're consistently pushing prices to create lower highs while price is holding at a consistent support level.
How to Identify
- Look for a horizontal line connecting at least two lows (support).
- Identify a downward sloping trendline connecting at least two highs (resistance).
- The price should bounce between these two lines, creating a triangular shape.
- Volume often decreases as the pattern forms, then increases on the breakout.
Trading Strategies
Breakout Trading
The most common strategy is to enter a short position when the price breaks below the support line.
- Entry: When price closes below the horizontal support line
- Stop Loss: Just above the breakout point or the last swing high within the pattern
- Take Profit: Project the height of the triangle from the breakout point downwards
Anticipation Trading
More aggressive traders might enter a short position near the resistance line, anticipating the breakdown.
- Entry: When price approaches the falling resistance line
- Stop Loss: Just above the resistance line
- Take Profit: At or below the support line
Risk Management
While descending triangles are generally bearish, they can sometimes break to the upside. Always use stop-loss orders to protect your positions. Be cautious of false breakouts, and consider waiting for a confirming candle or increased volume on the breakout before entering a trade. The longer the pattern takes to form, the more significant the eventual breakout is likely to be.
Example
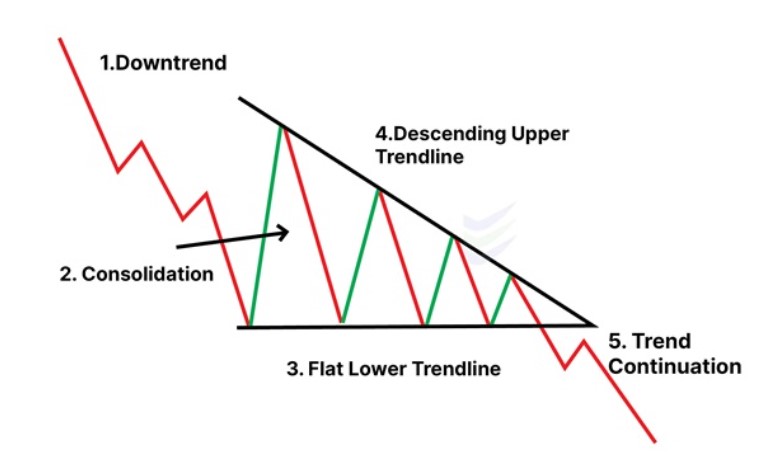
In this example, we can see the price consistently bouncing off a flat support line while creating lower highs, forming a descending upper trendline. Eventually, the price breaks down below the support, confirming the bearish nature of the descending triangle pattern.