Close to Resistance Pattern
Description
The "Close to Resistance" pattern occurs when the price of an asset approaches a known resistance level. Resistance is a price level where selling interest is strong enough to overcome buying pressure, potentially causing the price to reverse downwards.
How to Identify
- Look for a clear upward trend or a rally in a downtrend.
- Identify a resistance level based on previous price reactions or significant highs.
- The current price should be approaching, but not yet touching, this resistance level.
Trading Strategies
Anticipatory Short Entry
Enter a short position as the price approaches the resistance level, anticipating a reversal.
- Entry: When price is within 1-3% of the resistance level, depending on the asset's volatility.
- Stop Loss: Just above the resistance level.
- Take Profit: Previous swing low or next support level.
Confirmation Short Entry
Wait for confirmation of the reversal before entering a short position.
- Entry: When price shows a reversal signal (e.g., bearish candlestick pattern) near the resistance.
- Stop Loss: Above the recent high or resistance level.
- Take Profit: Next support level or a predetermined risk-reward ratio.
Risk Management
Always use stop-loss orders to protect against unexpected market moves. The strength of the resistance level can be gauged by the number of times it has been tested. However, be aware that resistance levels can be broken, especially in strong trending markets or after significant news events.
Example
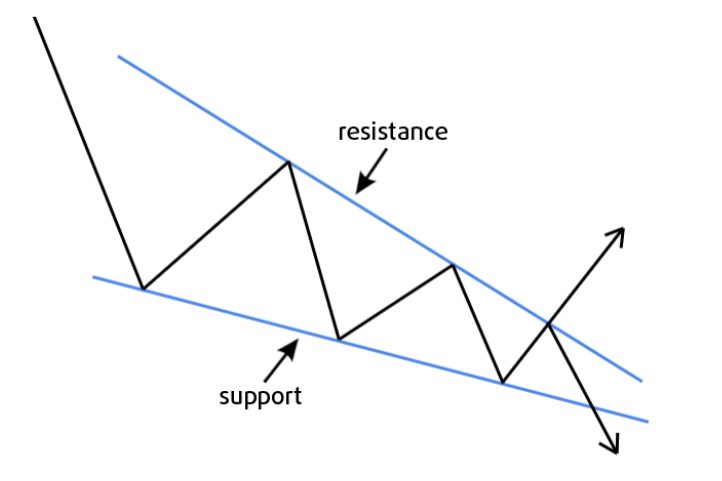
In this example, we can see the price approaching a well-established resistance level. Notice how the price has previously reversed from this level multiple times, indicating its significance.