Ascending Triangle Pattern
Description
An ascending triangle is a bullish chart pattern characterized by a flat upper trendline (resistance) and a rising lower trendline (support). This pattern indicates that buyers are more aggressive than sellers, as they're consistently pushing prices to test the resistance level while creating higher lows.
How to Identify
- Look for a horizontal line connecting at least two highs (resistance).
- Identify an upward sloping trendline connecting at least two lows (support).
- The price should bounce between these two lines, creating a triangular shape.
- Volume often decreases as the pattern forms, then increases on the breakout.
Trading Strategies
Breakout Trading
The most common strategy is to enter a long position when the price breaks above the resistance line.
- Entry: When price closes above the horizontal resistance line
- Stop Loss: Just below the breakout point or the last swing low within the pattern
- Take Profit: Project the height of the triangle from the breakout point
Anticipation Trading
More aggressive traders might enter a long position near the support line, anticipating the breakout.
- Entry: When price approaches the rising support line
- Stop Loss: Just below the support line
- Take Profit: At or above the resistance line
Risk Management
While ascending triangles are generally bullish, they can sometimes break to the downside. Always use stop-loss orders to protect your positions. Be cautious of false breakouts, and consider waiting for a confirming candle or increased volume on the breakout before entering a trade. The longer the pattern takes to form, the more significant the eventual breakout is likely to be.
Example
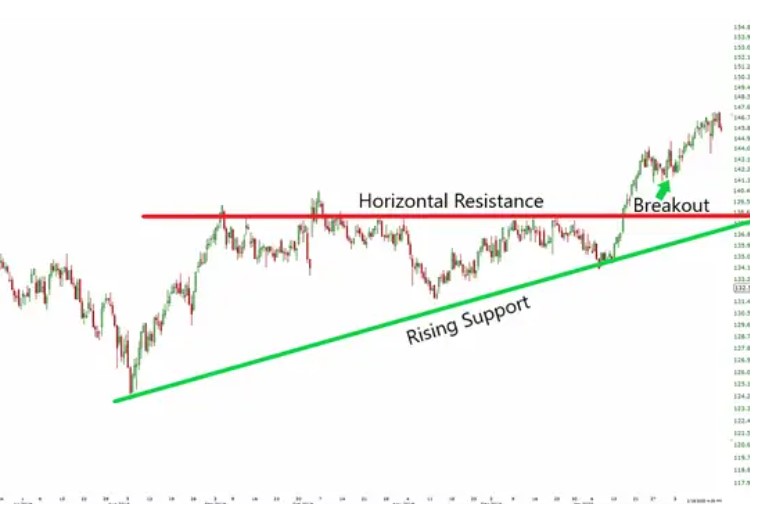
In this example, we can see the price consistently bouncing off a rising support line while hitting a flat resistance level multiple times. Eventually, the price breaks out above the resistance, confirming the bullish nature of the ascending triangle pattern.